
Deliver results, today.
Define your project, add your data—get instant insights, maps, graphs, and reports. No code, no GIS, no costly manual tools. Onboard teams, capture high-quality data, track essential metrics, and share fact-based results. Collaborate and scale effortlessly. Spend time where it actually matters—build trust, credibility, and impact with eOceans.

eOceans is the first-of-its-kind, patent-pending platform that ingests data from any source, manages it at the project scale, and automatically updates the project’s maps, graphs, and reports as new data arrive. Think of it as accounting software plus publishing software, all in one place.
HOW IT WORKS.
eOceans delivers essential tools for projects that rely on spatio-temporal data.
01. Define your project
Start by filling out this simple form with project details: study area boundaries (e.g., geofence), sampling methodologies, and variables (e.g., species, social values, threats, environment). From your specified data sources, eOceans only ingests data that matches these criteria—including absences (zeros)—so your project is precise from the start.
**Which means your project is live and ready to go in minutes.

02. Stream in data
Bring your project’s data to life in multiple ways: upload spreadsheets with our Magic Uploads™ tool, stream near real-time data from the eOceans mobile app, log observations after the fact, or integrate sensors via custom API.
**Which means you are ready to go forward—massively increasing your team’s capacity.

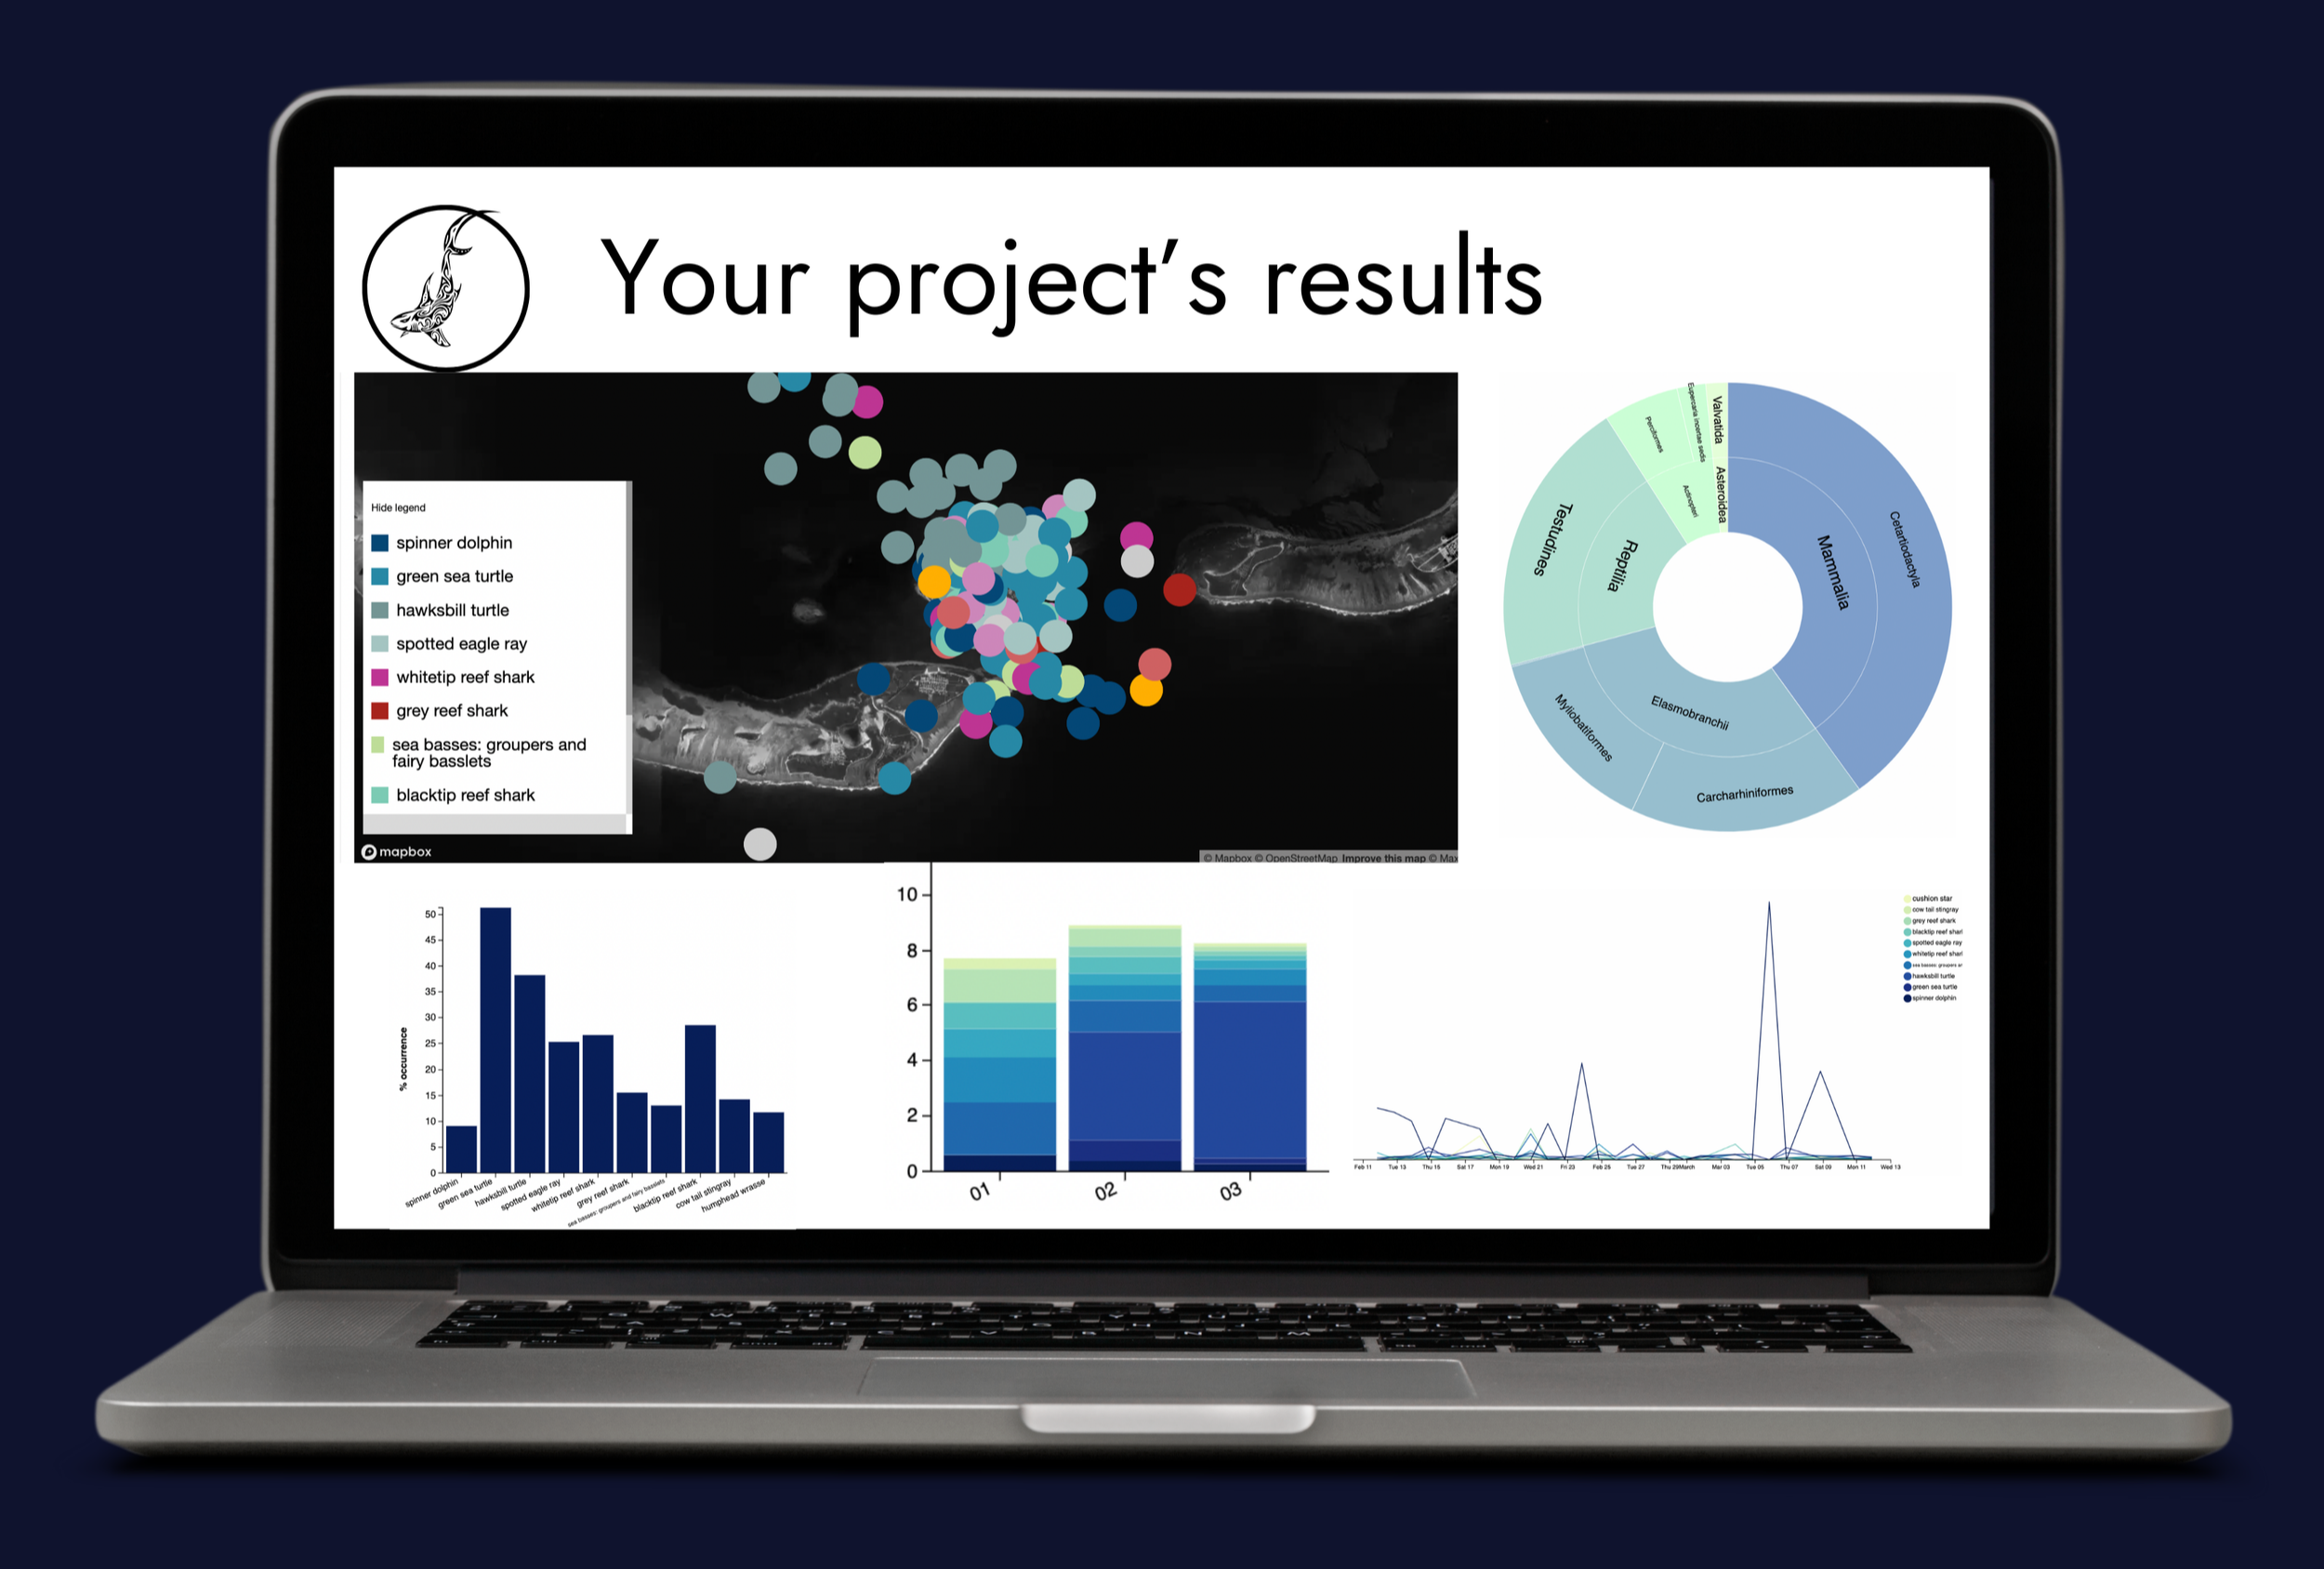
03. Review results
As data flows in to your project ledger, you can quality-check data on the go and review results in near real time: sampling effort, presence/absence, frequency of occurrence, relative abundance, and more—visualized in tables, maps, and graphs. Use the many built-in filters to get the insights you need.
**Which means you are the one who always know what’s happening.
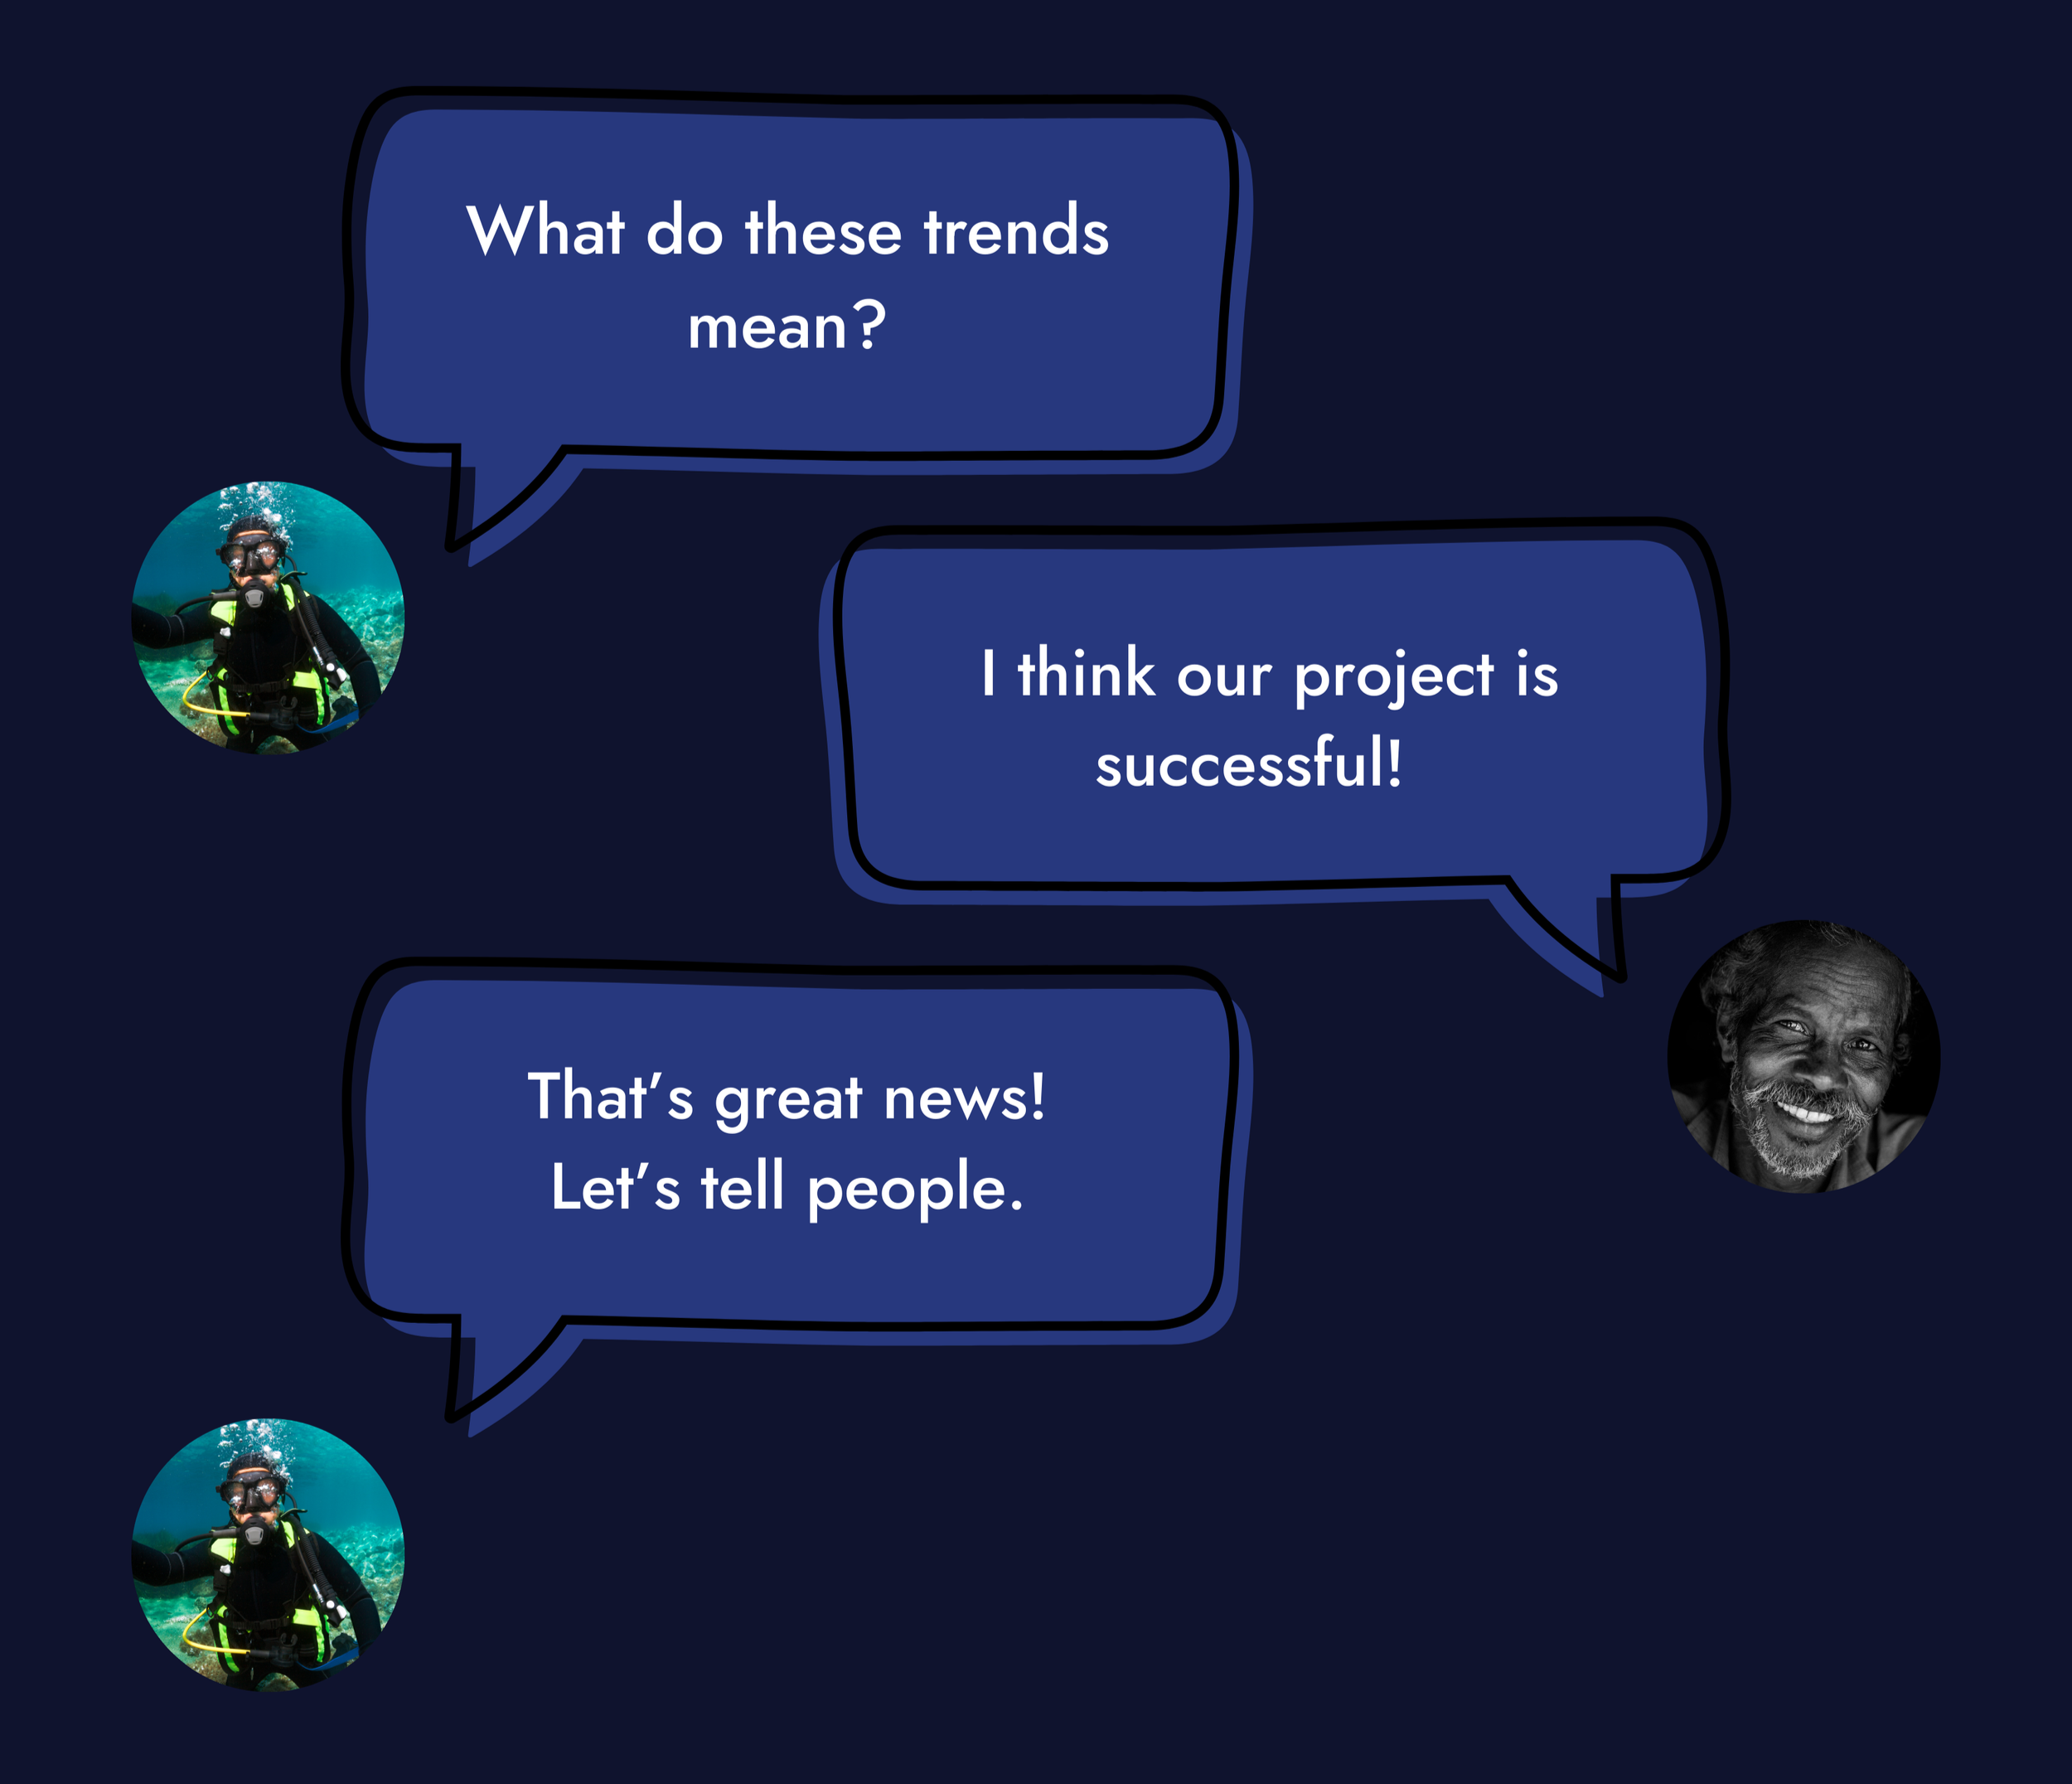
04. Share findings
Up-to-date results are always at your fingertips, so you can debrief your team, customers, stakeholders, rights-holders, or the public with confidence.
**Which means you are able to accelerate your mission, reputation, and impact.
00. Add on specialised tools
DATA DOWNLOADS — Export your project data and metadata in standardised, interoperable formats (Darwin Core, WoRMS).
**Which means you save hundreds of hours on cleaning, management, and querying.
MAGIC UPLOADS — Instantly bring existing or historical data into your project from desktops or archives.
**Which means you can finally present results that bring clarity and value to what you already have.
PRIVATE PROJECTS — Run projects privately, not viewable to those outside your team, until you’re ready to share, without losing any functionality.
**Which means you get the full power of eOceans without spending millions to build your own system.
SCORES — Expert-developed algorithms track project status (e.g., Smart Fishery Tracker, Blue Economy Tracker, MPA Health Tracker).
**Which means you can measure and communicate success transparently and quickly and get the right investments.
ACCURATE MAPS — When you need to know exactly what’s happening where, precise maps are shown to the ADMIN ONLY.
**Which means you get the accuracy you need without recreating maps from scratch.
