Does your Protected Area work? Not just lines on a map.
Measure and track protected are performance—surveillance, compliance, biodiversity, threats—seamlessly, all in one place.

Built for speed. Built for trust. Built for impact. Proudly Canadian.
How is your Protected Area performing?
Most assessments cost hundreds of thousands, take months or years to complete, and are outdated the moment they're published—if they happen at all.
With an eOceans subscription and a steady stream of data from your own scientists, observers, and guardians, eOceans empowers you to monitor your Protected Area’s success, values, and threats in real time—so you can demonstrate progress, build trust, and ensure your area delivers on its mission.
The one platform purpose-built for your success.
Track anything through space and time. Get insights locally or globally. Collaborate with anyone. Influence policy and decision making.

80% time saved. 100% mission focused.
The app you’ve been dreaming of.
Imagine every observation—from rangers, guardians, educators, compliance officers, scientists, and citizen scientists—automatically combined to track your surveying efforts alongside the Protected Area’s biological, social, and anthropogenic conditions in real time, effortlessly.
Built by PhD scientists, eOceans removes bottlenecks, empowering your team to focus on solutions.


Your mission is our mission.
We help you get there faster, easier, and smarter.
Meet eOceans.
Success stories:
California deploys eOceans to collaboratively track the health and value of Marine Protected Areas.

SlingShot™ awardee protecting migrating whales from shipping industry in South Africa.
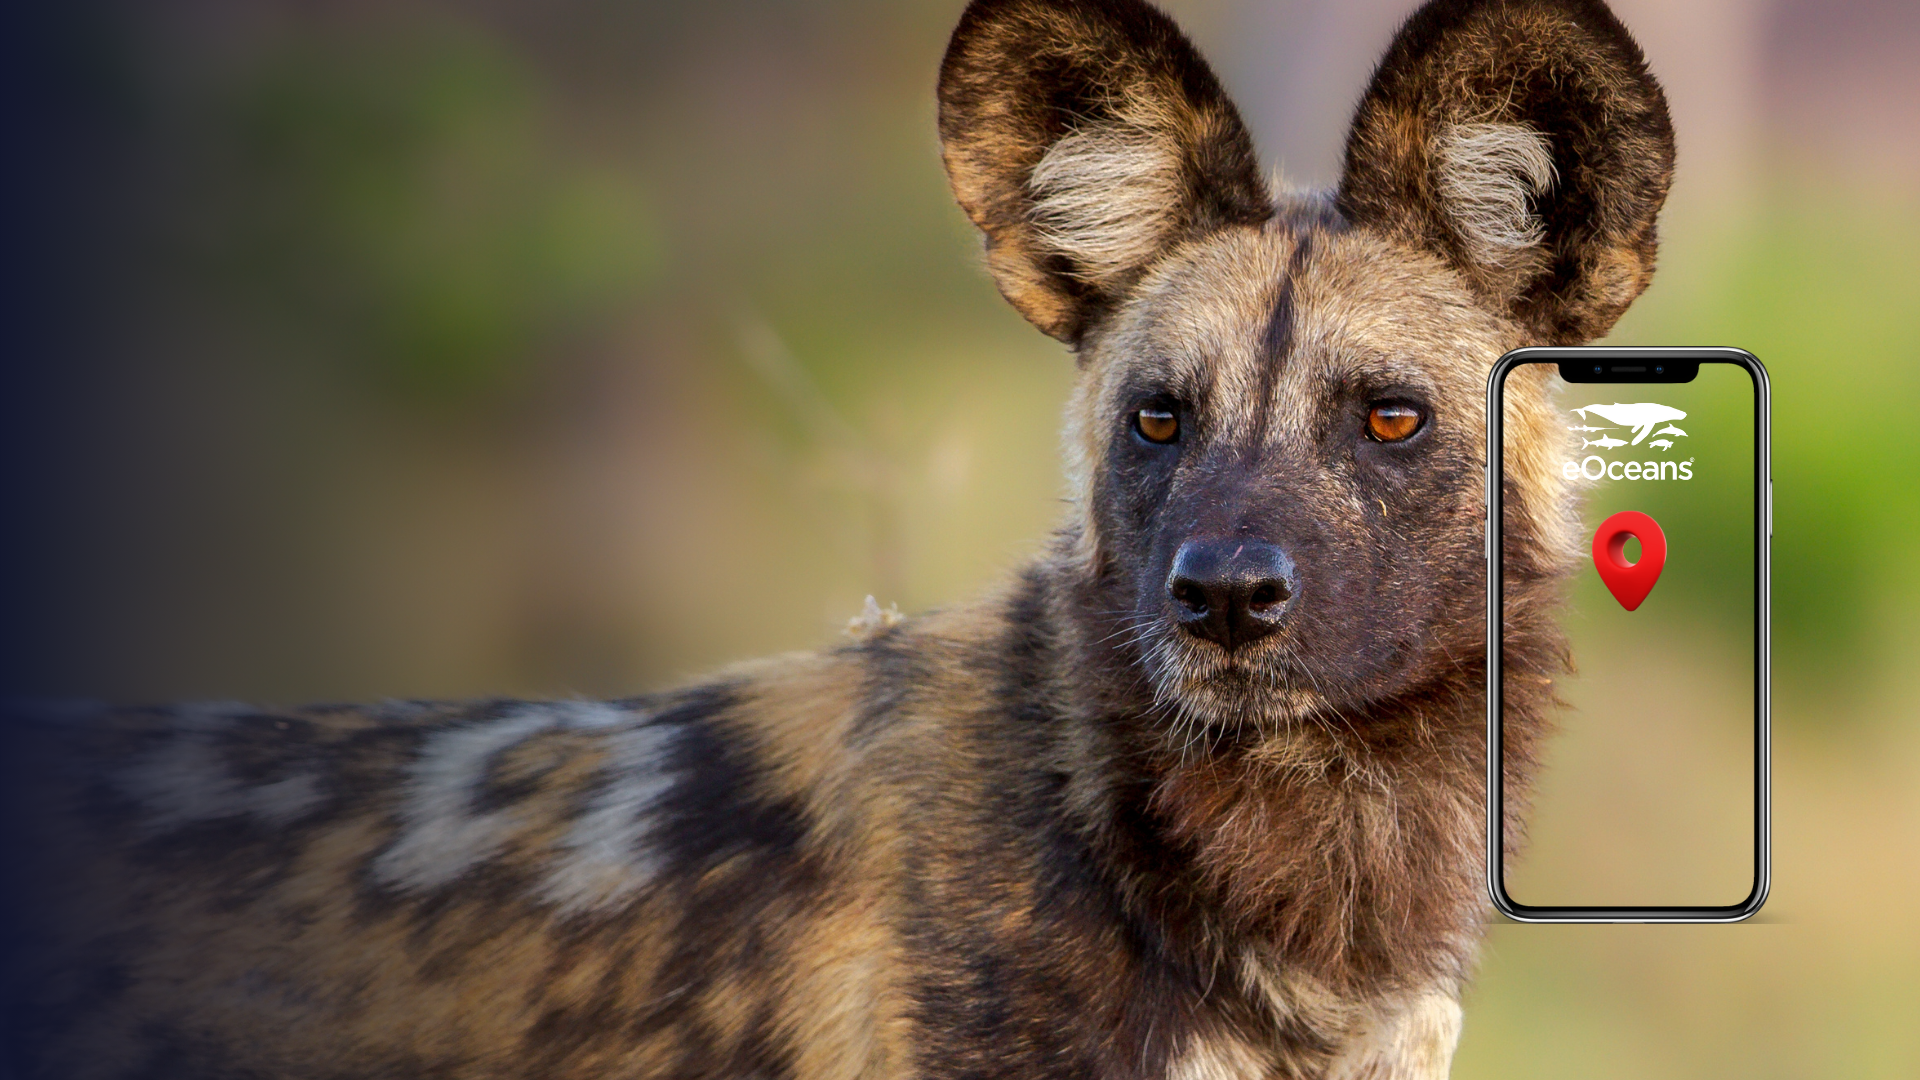
Wildlife is the main attraction for dive operators—this team is making sure it stays that way by deploying eOceans to track megafauna and to designate the right MPAs.
“I set out to build a better knowledge flow system—something I needed as a scientist. Today, it’s an app and platform anyone can use to build faster, smarter projects in our fast-changing, complex world.”
Dr. Christine Ward-Paige, CEO eOceans

Clients, Partners


Join others, start your Protected Area today.
Use the mobile app or dashboard to create and join projects, upload data, analyze results, contribute to science, and more.